
What is the Waffle House Index, and how does it work?
Curious to know how you can know the severity of any disaster and its potential damage? What if I provide you with an idea of an informal tool to measure the impact of a storm, tornado, hurricane, or any other disaster? If you’re unaware of the traditional methods like meteorological data, sophisticated models, and satellite imagery, then you can use them.
I’m talking about the Waffle House Index, a rapidly emerging tool to know the impact of disasters in recent years. It’s an informal metric to measure the severity of a storm, tornado, hurricane, or any other disaster. It reads a region’s readiness and recovery simply by checking whether Waffle House locations are open, running on generators with limited menus, or completely shut.
In simple words, it’s an indicator of the impact of natural disasters on any community in the USA. In our article related to Waffle House hours, we have clearly examined that Waffle House remains open 24/7 the whole year. It does not close even on special days and in disasters. By taking advantage of this reputation, the Waffle House index was introduced.
The History Behind Waffle House Index
Matt Dellinger, in a Summer 2006 Oxford American article titled “The Terrible Opportunity,” observed that by mapping Waffle House locations along the Mississippi coast, one could reveal the extent of Hurricane Katrina’s destruction. He noted that open Waffle Houses suggested less damage, while destroyed ones signaled the most severely affected areas.
In May 2011, FEMA Administrator Craig Fugate coined the phrase “Waffle House Index” after noticing that both Joplin, Missouri, Waffle Houses stayed open during the devastating EF‑5 tornado. Despite the tornado causing 158 deaths, 1,150 injuries, and approximately $2.8 billion worth of damage, the continuous operation of these restaurants highlighted their resilience and became a key indicator of community impact.
By late 2011, FEMA had begun using the index informally within its disaster-response protocols. While never officially codified, the Waffle House Index became a part of FEMA’s situational awareness toolkit and was even integrated with their software for disaster monitoring.
| 2006 | Dellinger correlated Waffle House status with disaster extent (Katrina). |
| 2004–2011 | Fugate tracks restaurant status during Charley and Joplin. |
| May 2011 | Coinage of “Waffle House Index” by Craig Fugate. |
| Post-2011 | FEMA adopts it informally; Waffle House formalizes its readiness strategy. |
How does it work?
The Waffle House Index relies on the well-earned reputation of Waffle House for staying open during extreme weather. Moreover, the ability of this restaurant chain to reopen after major storms like tornadoes and hurricanes, even if operating with a shortened menu, was also its foundation.
Waffle House maintains its reputation through its robust disaster-preparedness system that consists of dedicated jump teams, portable generators, temporary supply staging, and tiered menus designed for power outages and stock shortages. Its preparedness became a benchmark in corporate resilience, with companies like Home Depot, Walmart, and Lowe’s also noted for similar strategies.
Waffle House Index Levels
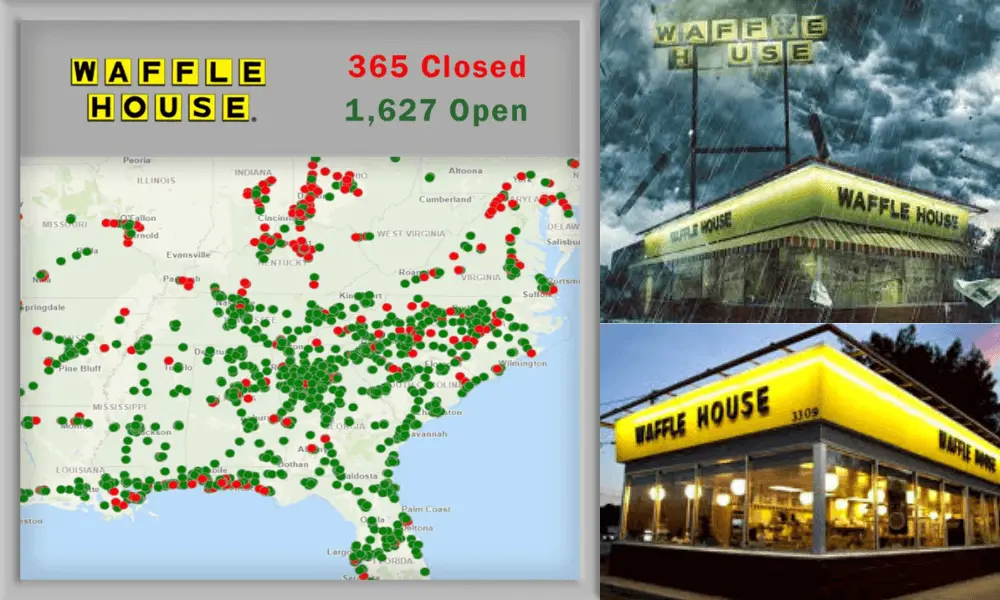
As the Waffle House Index is an informal tool to examine the impact of any storm on a community in the USA so you can’t completely rely on it. It is the best idea to follow any official tool or government instructions related to any disaster. However, you can estimate the impact of any natural disaster by analyzing the levels of the Waffle House Index. According to FEMA, there are the following index levels you need to examine through colors on the map of Waffle House locations:
|
Waffle House is offering the full menu as usual and using power. This indicates that the location has undergone minimal impact and its infrastructure is stable. | |
|
Waffle House is offering the full menu as usual and using power. This indicates that the location has undergone minimal impact and its infrastructure is stable. | |
|
Waffle House is offering the full menu as usual and using power. This indicates that the location has undergone minimal impact and its infrastructure is stable. |
Importance of Waffle House Index
There are the following benefits of the Waffle House Index:
Emergency Response
If a Waffle House is closed (a “Red” status), FEMA treats that as a dire signal. It shows severe damage and an urgent need for aid. It helps rapidly identify where first responders should go first.
Simplicity & Universality
This three-color code is easy to understand for both officials and the public to estimate the severity of any disaster.
Community Resilience Meter
A full (“Green”) or limited (“Yellow”) menu indicates how well a community’s infrastructure is holding up. It reflects power availability, supply chain health, and recovery speed.
Conclusion
The Waffle House Index is the easiest informal parameter to measure the level of disaster impact in any region. If you want to use it, simply open the map of Waffle House locations and notice the green, yellow, and red colors. Green is a signal of no damage, yellow means minor damage to infrastructure and power supply, while red signals a high level of disaster. This can be very helpful for making decisions about immediate security measures in any specific area.